| General Type |
Example |
Typical Titration Curve |
Features of Curve |
|---|
Strong Acid
added to
Strong Base |
HCl(aq) added to NaOH(aq)
Calculate a Titration Curve
|
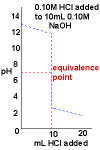 |
- Curve begins at high pH, a basic pH
- Curve ends ends at low pH, an acidic pH.
- Rapid change in pH near the equivalence point.
- pH = 7 at the equivalence point.
|
Strong Base
added to
Strong Acid |
NaOH(aq) added to HCl(aq)
Calculate a Titration Curve
|
 |
- Curve begins at low pH, an acidic pH
- Curve ends ends at high pH, a basic pH.
- Rapid change in pH near the equivalence point.
- pH = 7 at the equivalence point.
|
Strong Base
added to
Weak Acid |
NaOH(aq) added to acetic acid, CH3COOH(aq)
(See determination of acetic acid in vinegar) |
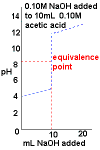 |
- Curve begins at low pH, an acidic pH
- Curve ends ends at high pH, a basic pH.
- Rapid change in pH near the equivalence point.
- pH > 7 at the equivalence point.
|
Weak Base
added to
Strong Acid |
Ammonia, NH3(aq), added to HCl(aq) |
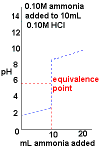 |
- Curve begins at low pH, an acidic pH
- Curve ends ends at high pH, a basic pH.
- Rapid change in pH near the equivalence point.
- pH < 7 at the equivalence point.
|
Weak Base
added to
Weak Acid |
Ammonia, NH3(aq), added to acetic acid, CH3COOH(aq) |
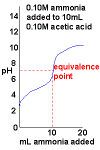 |
- Curve begins at low pH, an acidic pH
- Curve ends ends at high pH, a basic pH.
- No dramatic change in pH near the equivalence point.
This means this is a very difficult titration to perform.
- pH at the equivalence point will depend on the relative strengths of the acid and base used.
|
